The world’s elders in numbers
How many languages are fading, how the world is ageing and with whom people over 65 live — from open data of the World Bank, the United Nations and Glottolog. Every figure names its source and year.
World languages
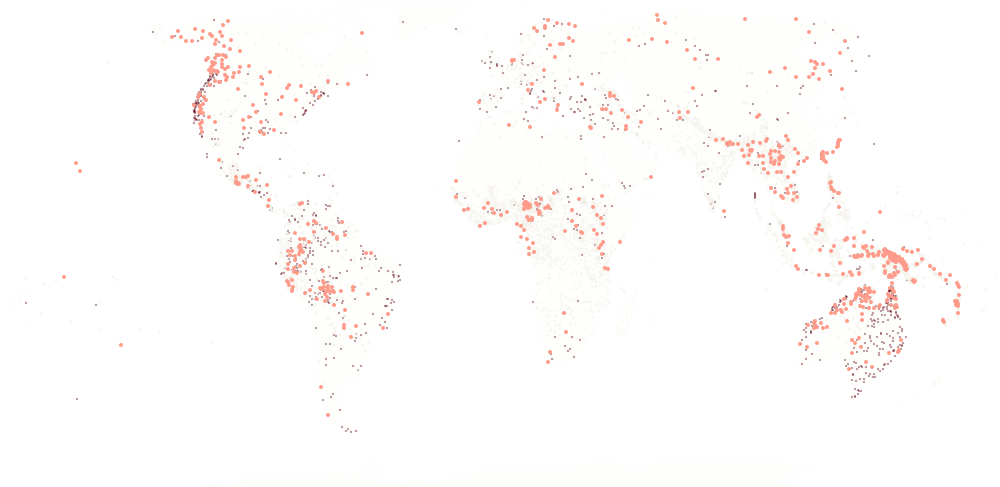
Glottolog v5.3: there are 6,981 living languages on Earth, 4,093 of them endangered, and 1,139 more are already gone.
- safe
- endangered
- on the brink
- gone
4,093 of 6,981 living languages are endangered. Another 1,139 are already gone.
Source: Glottolog v5.3, CC BY 4.0
- There are 6,981 living languages on Earth. Each dot is one of them.
- 4,093 of them are endangered.
- 1,139 languages are already gone: no one speaks them any more.
The world is ageing
In 1960 5% of people on Earth were older than 65, in 2025 — 10.4%, and by 2050, projected, 16.3%.
The countries with the largest share of people over 65 today:
- Monaco — 36%
- Japan — 30%
- Italy — 25.1%
- Portugal — 24.9%
- Greece — 24.4%
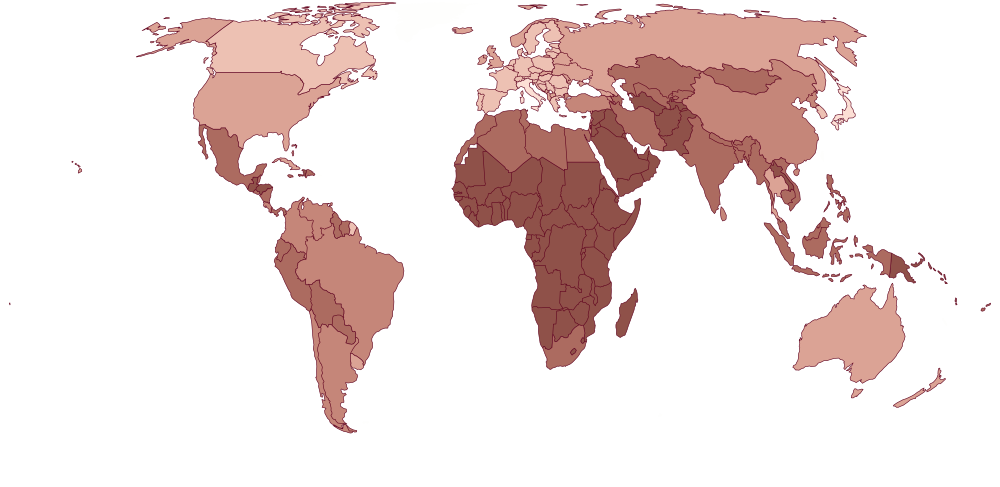
Share of people older than 65
- < 5 %
- 5–10 %
- 10–15 %
- 15–20 %
- 20–25 %
- ≥ 25 %
- no figure
Source: World Bank, World Development Indicators; projection: Population Estimates and Projections. CC BY 4.0
- 1960: 5% of people on Earth are older than 65.
- 1990: 6.1% of people on Earth are older than 65.
- 2025: 10.4% of people on Earth are older than 65.
- 2050, projected: 16.3% of people on Earth will be older than 65.
| Country | 2025 | 2050, projected |
|---|---|---|
| Uzbekistan | 6.1% | 10.4% |
| Kazakhstan | 9% | 13.8% |
| Kyrgyzstan | 6% | 10.1% |
| Tajikistan | 4.1% | 7.9% |
| Turkmenistan | 4.8% | 10.8% |
All countries
| Country | 2025 | 2050, projected |
|---|---|---|
| Monaco | 36% | 28.8% |
| Japan | 30% | 37.5% |
| Italy | 25.1% | 36.8% |
| Portugal | 24.9% | 33% |
| Greece | 24.4% | 34.6% |
| Finland | 24.2% | 28.2% |
| Germany | 23.7% | 30.3% |
| Croatia | 23.6% | 30.7% |
| San Marino | 23.1% | 36.9% |
| Serbia | 23.1% | 29.1% |
| Bosnia & Herzegovina | 22.9% | 34% |
| France | 22.5% | 27.6% |
| Bulgaria | 22.2% | 29.4% |
| Slovenia | 22.2% | 31.8% |
| Latvia | 22.2% | 29% |
| Estonia | 21.8% | 29.8% |
| Spain | 21.6% | 36.1% |
| Liechtenstein | 21.4% | 29.9% |
| Czechia | 21.2% | 29.6% |
| Hungary | 21.2% | 27.4% |
| Denmark | 21.1% | 25.6% |
| Austria | 21.1% | 30.8% |
| Belgium | 21% | 27.8% |
| Sweden | 20.9% | 25.7% |
| Netherlands | 20.9% | 26.3% |
| Poland | 20.8% | 31.8% |
| Lithuania | 20.7% | 28.6% |
| Malta | 20.5% | 30.6% |
| Switzerland | 20.4% | 30.2% |
| South Korea | 20.3% | 39.7% |
| Canada | 20.3% | 25.7% |
| Romania | 20.1% | 27.8% |
| United Kingdom | 19.7% | 24.7% |
| Norway | 19.1% | 26.8% |
| Slovakia | 19% | 30.1% |
| Ukraine | 19% | 29.1% |
| North Macedonia | 18.5% | 27.6% |
| United States | 18.4% | 23.1% |
| Montenegro | 18.3% | 26.6% |
| Belarus | 18.3% | 27.5% |
| Australia | 18.1% | 23.9% |
| Russia | 17.8% | 23.8% |
| Albania | 17.6% | 27.9% |
| New Zealand | 17.6% | 24% |
| Barbados | 17.1% | 24.4% |
| Cuba | 17% | 30.2% |
| Moldova | 16.9% | 21.6% |
| Andorra | 16.6% | 36.6% |
| Uruguay | 16.3% | 23.5% |
| Ireland | 16.2% | 26.1% |
| Thailand | 16% | 29.6% |
| Georgia | 16% | 20.8% |
| Iceland | 16% | 23.9% |
| Luxembourg | 15.8% | 26% |
| Cyprus | 14.9% | 26.5% |
| China | 14.9% | 30.9% |
| Chile | 14.6% | 26.7% |
| Armenia | 14.4% | 24% |
| Singapore | 14.2% | 26.8% |
| Mauritius | 14.1% | 26.1% |
| Dominica | 13.2% | 18.6% |
| Trinidad & Tobago | 12.9% | 23.9% |
| Costa Rica | 12.8% | 25.3% |
| North Korea | 12.7% | 21.4% |
| Israel | 12.7% | 15.7% |
| Argentina | 12.6% | 19.9% |
| Grenada | 12.6% | 20.2% |
| Sri Lanka | 12.5% | 20.3% |
| Antigua & Barbuda | 12.3% | 24.4% |
| St. Vincent & Grenadines | 12.3% | 19.1% |
| Bahamas | 12.1% | 21.2% |
| Palau | 11.8% | 20.3% |
| St. Kitts & Nevis | 11.7% | 20.6% |
| Brazil | 11.5% | 22.5% |
| Türkiye | 10.6% | 22.1% |
| Lebanon | 10.4% | 16.4% |
| Colombia | 10.2% | 20.6% |
| Venezuela | 10% | 16.4% |
| St. Lucia | 10% | 20.4% |
| Tunisia | 9.9% | 20.5% |
| Panama | 9.7% | 18.5% |
| Vietnam | 9.5% | 20% |
| Peru | 9.5% | 17.7% |
| Azerbaijan | 9.2% | 18.1% |
| Kazakhstan | 9% | 13.8% |
| Seychelles | 8.8% | 19% |
| Ecuador | 8.6% | 17.2% |
| Iran | 8.6% | 22.4% |
| Jamaica | 8.6% | 19.4% |
| Mexico | 8.5% | 17% |
| Morocco | 8.4% | 16.4% |
| El Salvador | 8.3% | 14.7% |
| Dominican Republic | 8.2% | 15% |
| Suriname | 8.2% | 15% |
| Malaysia | 8% | 16.8% |
| Indonesia | 7.5% | 15.1% |
| Myanmar (Burma) | 7.5% | 13.6% |
| India | 7.4% | 14.7% |
| Brunei | 7.2% | 19.3% |
| Cape Verde | 7.2% | 16.5% |
| Tuvalu | 7% | 8.7% |
| Guyana | 7% | 11.2% |
| South Africa | 6.9% | 11.3% |
| Tonga | 6.8% | 10.7% |
| Algeria | 6.8% | 16.2% |
| Paraguay | 6.7% | 12.4% |
| Bangladesh | 6.7% | 13.6% |
| Bhutan | 6.6% | 15.9% |
| Fiji | 6.6% | 10.6% |
| Nepal | 6.6% | 11.1% |
| Cambodia | 6.4% | 11.6% |
| Micronesia | 6.2% | 7.7% |
| Uzbekistan | 6.1% | 10.4% |
| Samoa | 6.1% | 8.1% |
| Kyrgyzstan | 6% | 10.1% |
| Bolivia | 5.7% | 9.8% |
| Philippines | 5.7% | 11.2% |
| Nicaragua | 5.7% | 12.8% |
| Mongolia | 5.4% | 12.6% |
| Egypt | 5.3% | 9.7% |
| Belize | 5.2% | 12.9% |
| Timor-Leste | 5.2% | 7% |
| Libya | 5.2% | 15.9% |
| Djibouti | 5% | 9.9% |
| Guatemala | 5% | 9.6% |
| Maldives | 5% | 21.5% |
| Marshall Islands | 4.9% | 12.9% |
| Syria | 4.8% | 9.3% |
| Laos | 4.8% | 9.9% |
| Turkmenistan | 4.8% | 10.8% |
| Haiti | 4.8% | 8.4% |
| Jordan | 4.8% | 12.1% |
| Honduras | 4.5% | 10.2% |
| Comoros | 4.5% | 6.6% |
| Kiribati | 4.4% | 7.4% |
| Vanuatu | 4.4% | 6.8% |
| Pakistan | 4.4% | 6.4% |
| Eswatini | 4.4% | 7.4% |
| Eritrea | 4.3% | 5.8% |
| Gabon | 4.1% | 7.2% |
| Botswana | 4.1% | 7.7% |
| Tajikistan | 4.1% | 7.9% |
| Bahrain | 4% | 8.5% |
| Rwanda | 4% | 6.2% |
| São Tomé & Príncipe | 3.9% | 6.7% |
| Lesotho | 3.9% | 5.9% |
| Palestinian Territories | 3.9% | 8% |
| Ghana | 3.8% | 7.4% |
| Namibia | 3.8% | 7% |
| Equatorial Guinea | 3.8% | 6.2% |
| Solomon Islands | 3.7% | 7.1% |
| Senegal | 3.7% | 6% |
| Papua New Guinea | 3.6% | 7.4% |
| Zimbabwe | 3.6% | 5.3% |
| Togo | 3.5% | 5% |
| Guinea | 3.5% | 4.6% |
| Madagascar | 3.5% | 5.4% |
| Iraq | 3.5% | 7.4% |
| Sudan | 3.4% | 5.3% |
| Liberia | 3.3% | 5% |
| Ethiopia | 3.3% | 5.4% |
| Sierra Leone | 3.3% | 5.5% |
| Mauritania | 3.3% | 4.7% |
| Guinea-Bissau | 3.2% | 5.7% |
| Gambia | 3.2% | 5.4% |
| Kuwait | 3.2% | 6.6% |
| Benin | 3.2% | 4.8% |
| Congo - Kinshasa | 3.1% | 3.5% |
| South Sudan | 3.1% | 5.9% |
| Nigeria | 3.1% | 4.5% |
| Congo - Brazzaville | 3.1% | 5.5% |
| Saudi Arabia | 3.1% | 8.2% |
| Tanzania | 3% | 4.5% |
| Kenya | 3% | 5.7% |
| Nauru | 3% | 6.2% |
| Angola | 2.9% | 4% |
| Cameroon | 2.8% | 4.8% |
| Mozambique | 2.7% | 3.6% |
| Oman | 2.7% | 6.5% |
| Burkina Faso | 2.7% | 4.7% |
| Côte d’Ivoire | 2.7% | 4.7% |
| Niger | 2.6% | 3.5% |
| Somalia | 2.6% | 3.5% |
| Malawi | 2.6% | 4.9% |
| Burundi | 2.6% | 4.6% |
| Yemen | 2.6% | 5.2% |
| Afghanistan | 2.4% | 4% |
| Mali | 2.4% | 3.5% |
| Uganda | 2.2% | 4.3% |
| Central African Republic | 2.2% | 2% |
| Chad | 2.1% | 3.2% |
| Zambia | 2% | 4.8% |
| United Arab Emirates | 1.8% | 2.1% |
| Qatar | 1.7% | 3% |
Where elders live
In the middle country of 167, 13.9% of people over 65 live alone. In the typical country women live alone 1.7 times as often as men.
In collective quarters — care homes, hospitals, hostels and the like — the middle figure is 1.1% of people over 65, across 116 countries where a census counted them.
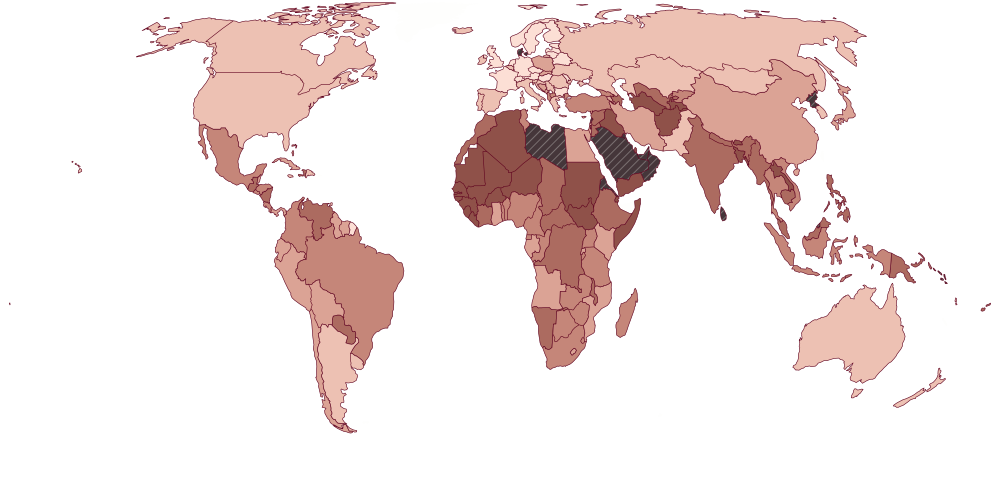
Share of people older than 65 living alone
- < 5 %
- 5–10 %
- 10–15 %
- 15–20 %
- 20–30 %
- ≥ 30 %
- no figure
Share of people older than 65 in collective quarters
- < 0.5 %
- 0.5–1 %
- 1–2 %
- 2–4 %
- 4–6 %
- ≥ 6 %
- no figure
Source: United Nations, Population Division, databases on the living arrangements of older persons (2026) and on older persons in collective living quarters (2022). CC BY 3.0 IGO
- In Uzbekistan 6.1% of people older than 65 live alone. Across the world the middle figure is 13.9%.
- In collective quarters — care homes, hospitals, hostels and the like — the middle figure is 1.1% of people older than 65, across 116 countries with census figures.
| Country | Live alone | In collective quarters |
|---|---|---|
| Uzbekistan | 6.1%2021, MICS | — |
| Kazakhstan | 25.2%2024, MICS | — |
| Kyrgyzstan | 10.3%2023, MICS | 0.3%2009 |
| Tajikistan | 2.3%2023, DHS | — |
| Turkmenistan | 3.4%2024, MICS | — |
All countries
| Country | Live alone | In collective quarters |
|---|---|---|
| Finland | 36.7%2021, DYB | — |
| Estonia | 35.6%2022, DYB | 2.9%2011 |
| Latvia | 35.4%2021, DYB | 1.7%2011 |
| Netherlands | 35.4%2011, LFS | 6.5%2001 |
| Lithuania | 33.9%2021, DYB | 1.3%2011 |
| France | 33.1%2020, DYB | 5.6%2015 |
| Germany | 32.7%2022, DYB | 4.3%2011 |
| Bulgaria | 32.5%2011, LFS | 0.4%2001 |
| Norway | 32.2%2021, DYB | 3.2%2011 |
| Belarus | 32.1%2019, DYB | 0.3%2009 |
| Czechia | 31.8%2021, DYB | 3%2011 |
| Austria | 31.7%2021, DYB | 4.3%2011 |
| United Kingdom | 31%2011, DYB | 3.7%2011 |
| Hungary | 30.6%2022, DYB | 3.4%2011 |
| Sweden | 30.5%2012, DYB | 3.5%2011 |
| Switzerland | 30.4%2022, DYB | 7.2%2000 |
| Moldova | 30.3%2014, DYB | 0.4%2014 |
| Russia | 29.7%2010, IPUMS | 0.6%2010 |
| Ukraine | 29.5%2012, MICS | 0.3%2001 |
| Belgium | 29.2%2021, DYB | 5.3%2011 |
| Liechtenstein | 29%2021, DYB | 4%2015 |
| Italy | 28.3%2021, DYB | 1.6%2011 |
| United States | 27.2%2020, IPUMS | 3.2%2015 |
| Iceland | 26.9%2021, DYB | — |
| Romania | 26.8%2011, IPUMS | 0.5%2011 |
| Slovenia | 26.3%2021, DYB | 5%2015 |
| St. Lucia | 26%2012, MICS | — |
| Kazakhstan | 25.2%2024, MICS | — |
| São Tomé & Príncipe | 25.2%2019, MICS | — |
| Canada | 25%2021, DYB | 7.7%2016 |
| New Zealand | 24.9%2018, DYB | 5.3%2018 |
| Barbados | 24.8%2012, MICS | — |
| Ireland | 24.7%2022, DYB | 7.7%2016 |
| Mongolia | 24.6%2020, IPUMS | 0.5%2000 |
| Australia | 23.9%2021, DYB | 7.6%2016 |
| Luxembourg | 23.7%2021, DYB | 7.6%2011 |
| Croatia | 23%2021, DYB | 2.8%2011 |
| Argentina | 23%2022, DYB | 2.9%2010 |
| Serbia | 22.9%2022, DYB | 0.8%2011 |
| Uruguay | 22.9%2013, MICS | 2.8%2011 |
| Pakistan | 22.3%2017, DYB | 3.1%1973 |
| Greece | 22.2%2011, IPUMS | 0.9%2011 |
| Jamaica | 21.9%2022, MICS | 1.2%2011 |
| Spain | 21.6%2021, DYB | 2.2%2011 |
| Vanuatu | 21.3%2023, MICS | — |
| Portugal | 21.2%2021, DYB | 4.2%2011 |
| Malta | 20.9%2021, DYB | 6.9%2011 |
| Trinidad & Tobago | 20.4%2022, MICS | 2.6%2011 |
| Dominican Republic | 20.3%2022, DYB | 0.2%2010 |
| South Korea | 20.2%2020, DYB | — |
| Rwanda | 19.8%2023, DHS | 2.2%2012 |
| Japan | 19.7%2020, DYB | 17%2005 |
| Israel | 19.4%2022, DYB | 8.4%2008 |
| Gabon | 19.1%2020, DHS | — |
| Lesotho | 18.6%2023, DHS | 0.3%2006 |
| Angola | 18.6%2023, DHS | — |
| Bolivia | 18.6%2012, IPUMS | 1.4%2012 |
| Poland | 18.6%2021, DYB | 1%2011 |
| Cuba | 18.5%2019, MICS | 0.6%2012 |
| Bosnia & Herzegovina | 18.2%2012, MICS | — |
| Iran | 18.1%2011, IPUMS | 0.2%2011 |
| Belize | 17.9%2022, DYB | — |
| Ecuador | 17.8%2022, DYB | 0.2%2010 |
| Guyana | 17.8%2019, MICS | — |
| Cyprus | 17.8%2011, DYB | 2.2%2011 |
| Chile | 17.4%2024, DYB | 2.2%2002 |
| Armenia | 17.3%2016, DHS | 0.5%2011 |
| Panama | 17.1%2023, DYB | 2.1%2000 |
| Montenegro | 16.7%2018, MICS | 0.5%2011 |
| Egypt | 16.7%2014, DHS | 0.4%2006 |
| Slovakia | 16.5%2021, DYB | 2.8%2011 |
| Mozambique | 16.3%2022, DHS | — |
| Suriname | 16.1%2018, MICS | — |
| Ghana | 15.9%2022, DHS | 1.6%2010 |
| Kenya | 15.7%2022, DHS | 0.4%1999 |
| China | 15.7%2020, China Population Census Yearbook 2020 | 0.3%2000 |
| Peru | 15.2%2017, IPUMS | 1.7%2017 |
| Bahamas | 14.9%2010, DYB | 1%2010 |
| Colombia | 14.9%2018, DYB | 0.8%2018 |
| South Africa | 14.9%2022, DYB | 4%2011 |
| Brazil | 14.6%2010, IPUMS | 0.8%2010 |
| Palestinian Territories | 14.6%2020, MICS | 0.2%2007 |
| Georgia | 14.3%2018, MICS | — |
| Thailand | 13.9%2022, MICS | 1.5%2000 |
| Mexico | 13.4%2020, IPUMS | 0.4%2010 |
| Burundi | 13.4%2016, DHS | — |
| North Macedonia | 13.1%2019, MICS | — |
| Costa Rica | 12.8%2018, MICS | 1.1%2011 |
| Congo - Brazzaville | 12.8%2015, MICS | — |
| Togo | 12.8%2022, DYB | 0.2%2010 |
| Türkiye | 12.6%2018, DHS | 1.5%2000 |
| Mauritius | 12%2022, DYB | — |
| Botswana | 11.9%2011, IPUMS | 0.6%2011 |
| Madagascar | 11.7%2021, DHS | — |
| Benin | 11.7%2021, MICS | 1.1%2013 |
| Equatorial Guinea | 11.3%2000, MICS | — |
| Vietnam | 11.2%2020, MICS | 0.3%1989 |
| Zimbabwe | 11.1%2019, MICS | 1.1%2012 |
| El Salvador | 11.1%2014, MICS | 0.3%2007 |
| Honduras | 11%2019, MICS | 0.2%2001 |
| Uganda | 10.9%2024, DHS | 0.6%2002 |
| Tunisia | 10.8%2023, MICS | — |
| Tanzania | 10.7%2022, DHS | 0.1%2002 |
| Albania | 10.6%2017, DHS | 0.2%2011 |
| Indonesia | 10.4%2017, DHS | 0%2010 |
| Eswatini | 10.4%2021, MICS | 0.2%2007 |
| Zambia | 10.4%2024, DHS | 1.1%2000 |
| Nigeria | 10.4%2024, DHS | — |
| Cameroon | 10.3%2022, DHS | 0.1%2005 |
| Kyrgyzstan | 10.3%2023, MICS | 0.3%2009 |
| Paraguay | 9.9%2016, MICS | 0.5%2002 |
| Jordan | 9.8%2023, DHS | 0.8%2004 |
| Azerbaijan | 9.5%2023, MICS | — |
| Philippines | 9.1%2022, DHS | 0.2%2015 |
| Chad | 8.8%2019, MICS | — |
| Timor-Leste | 8.7%2016, DHS | 0.2%2004 |
| Venezuela | 8.3%2001, IPUMS | 1.1%2001 |
| Malaysia | 8.3%2000, IPUMS | 1%2010 |
| Haiti | 8.2%2017, DHS | 0.2%2003 |
| Malawi | 7.7%2024, DHS | 1%2008 |
| Fiji | 7.5%2021, MICS | 0.2%2014 |
| Central African Republic | 7.3%2019, MICS | — |
| Guatemala | 7.1%2015, DHS | 0.3%2002 |
| Congo - Kinshasa | 7%2023, DHS | — |
| Namibia | 6.8%2013, DHS | 1.7%2001 |
| Nauru | 6.6%2023, MICS | — |
| Nicaragua | 6.5%2005, IPUMS | 0.4%2005 |
| Côte d’Ivoire | 6.2%2021, DHS | — |
| Morocco | 6.1%2014, IPUMS | — |
| Uzbekistan | 6.1%2021, MICS | — |
| Cambodia | 6%2021, DHS | 1.4%2008 |
| Tonga | 5.8%2019, MICS | — |
| Ethiopia | 5.8%2019, DHS | 1.5%2007 |
| Nepal | 5.7%2025, MICS | — |
| Syria | 5.7%2006, MICS | — |
| Myanmar (Burma) | 5.7%2016, DHS | 3.1%2014 |
| Papua New Guinea | 5.2%2000, IPUMS | 0.3%2000 |
| India | 5.1%2020, DHS | — |
| Maldives | 4.6%2017, DHS | 1.8%2014 |
| Tuvalu | 4.4%2020, MICS | — |
| Burkina Faso | 4.3%2014, DHS | — |
| Laos | 4.1%2023, MICS | 1.1%2015 |
| South Sudan | 4%2010, MICS | — |
| Comoros | 4%2022, MICS | — |
| Bhutan | 4%2010, MICS | — |
| Liberia | 3.6%2022, DHS | 1%2008 |
| Somalia | 3.5%2011, MICS | — |
| Turkmenistan | 3.4%2024, MICS | — |
| Mauritania | 3.2%2015, MICS | — |
| Samoa | 2.9%2019, MICS | 0.7%2016 |
| Niger | 2.9%2021, DHS | — |
| Djibouti | 2.8%2006, MICS | — |
| Sudan | 2.7%2014, MICS | — |
| Bangladesh | 2.6%2022, DHS | 0.2%2011 |
| Yemen | 2.6%2023, MICS | — |
| Sierra Leone | 2.4%2019, DHS | 0.1%2015 |
| Algeria | 2.3%2019, MICS | — |
| Tajikistan | 2.3%2023, DHS | — |
| Iraq | 2.2%2018, MICS | 0.4%1997 |
| Guinea | 2.1%2021, DHS | 0%1996 |
| Senegal | 1.9%2023, DHS | 0.2%2013 |
| Guinea-Bissau | 1.7%2019, MICS | — |
| Gambia | 1.3%2020, DHS | — |
| Kiribati | 1.3%2018, MICS | — |
| Mali | 0.5%2024, DHS | 0%1998 |
| Afghanistan | 0.2%2023, MICS | — |
| Qatar | 0.2%2023, MICS | 10.5%2010 |
| Monaco | — | 2.6%2016 |
| Oman | — | 1.1%2003 |
| Seychelles | — | 3.3%2002 |
Find your country
Choose a country to see its figures and the way to its page.
How we counted
- The share of people over 65: World Bank, World Development Indicators up to 2025; after that, the World Bank’s projection (Population Estimates and Projections). Both rest on the UN World Population Prospects.
- “Live alone” is the share of people over 65 in one-person households. UN Population Division, database on the households and living arrangements of older persons 2026: 167 of our countries, each with its latest survey or census.
- “Collective quarters”, as the UN defines them: hotels and hostels, care homes, hospitals, barracks, worker camps, prisons, boarding schools and monasteries. UN Population Division, database on older persons in collective living quarters 2022: 116 of our countries, census figures from 1960 to 2018.
- The middle figure (median) is the country in the middle of the list: half the countries have more, half less. It is not the average over the world’s people.
- Languages: Glottolog v5.3, endangerment on the AES scale.